Data Analyst Salary in Sterling Heights, MI: $59,502 (2026)
Quick Answer:A full-time data analyst in Sterling Heights, MI earns a median $59,502/year (≈ $28.61/hour) in nominal terms for 2026 — projected from BLS OEWS 2025 (SOC 15-2051). Once you factor in Sterling Heights's price level (7% below national, BEA RPP 93.2), that paycheck buys what $63,843 would nationally. Nominal pay sits 2.1% above the Michigan state average.
Based on BLS state-level estimates · View source
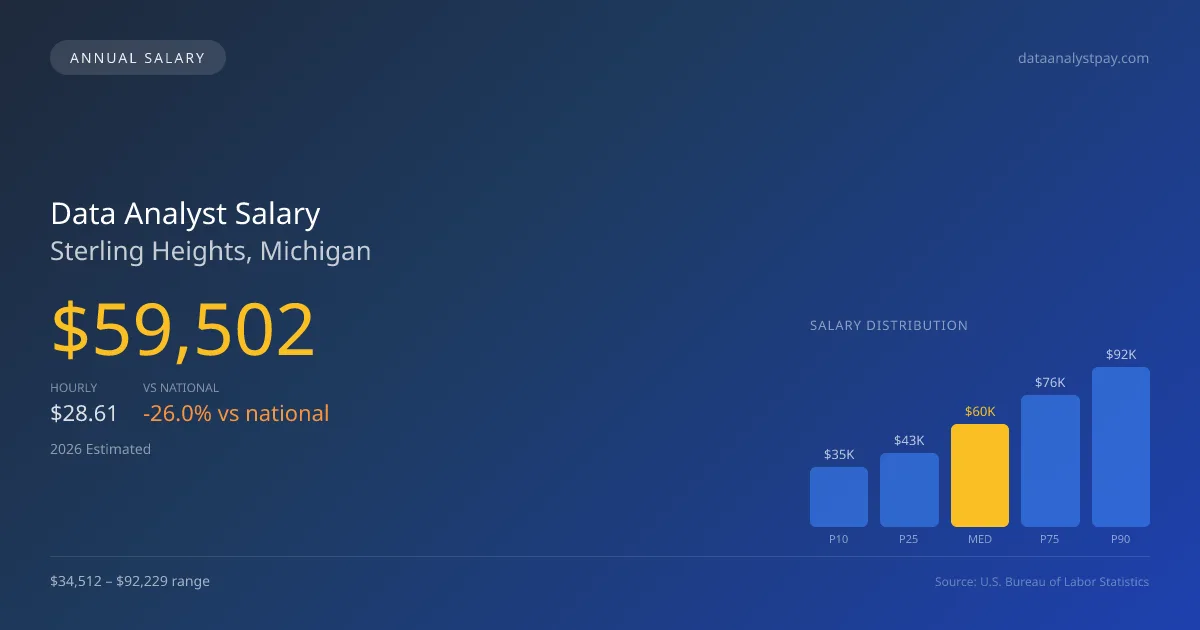
Data analysts in Sterling Heights, MI can expect a median annual salary of $59,502 in 2026, a figure significantly below the national median of $80,394. Salaries for this role range from $34,512 at the 10th percentile to $92,229 at the 90th percentile, reflecting a diverse market for data-related positions. This compensation framework is derived from estimates based on 2025 BLS data, adjusted for regional cost variances. Given the notable difference in pay when compared to national averages, potential analysts in Sterling Heights may find opportunities for advancement challenging but present, particularly for those aiming for higher band levels in their careers, which often yield greater total compensation.
About the Sterling Heights Market
Salary estimated from Michigan average ($105,000) adjusted for local cost of living.
Salary Breakdown
| Percentile | Annual | Hourly |
|---|---|---|
| Entry Level (P10) | $34,512 | $16.59 |
| Lower Range (P25) | $42,842 | $20.59 |
| Median (P50)(typical) | $59,502 | $28.61 |
| Upper Range (P75) | $76,163 | $36.62 |
| Top Earners (P90) | $92,229 | $44.34 |
Median Salary Position
25.99% below the national average
2026 Salary Percentile Distribution in Sterling Heights
In Sterling Heights, MI, the data analyst salary spread from the 10th to 90th percentile is $57,717 (2026 est.). At $59,502, the local median is 25.99% below the national median of $80,394.
Salary Calculator
At 40 hours/week in Sterling Heights: You'd be in the lower-middle range
How Sterling Heights Data Analyst Pay Compares
Sterling Heights median: $59,502/year (2026)
| Compared To | Median Salary | Sterling Heights Pays |
|---|---|---|
| Michigan Average | $58,279 | +2.10% more |
| National Average | $80,394 | -25.99% less |
Data Analysts in Sterling Heights, MI earn a median of $59,502 per year (2026 est.), which is 25.99% lower than the national median of $80,394 and 2.10% above the Michigan state average of $58,279.
Cost-of-Living Adjusted Salary
Sterling Heights has a cost of living 6.80% below the national average, meaning your salary goes further here.
Adjusted salary = nominal × (100 / CoL index). CoL index: 100 = national average.
Sterling Heights, MI has a cost-of-living index of 93.2 (below the national average of 100). A data analyst earning $59,502 nominally has purchasing power equivalent to $63,843 in an average-cost city — an effective 7.3% boost.
Compare Purchasing Power
Select a city to see how your salary compares after cost of living
Select a city above to compare purchasing power
2021 BLS Actual
$47,799
2025 BLS Actual
$56,951
2026 Current Est.
$59,502
2021–2027 Growth
+30.1%
Salary Trajectory for Data Analysts in Sterling Heights (2021–2027)
2021–2025: actual BLS OEWS data for this metro area. 2026+: CAGR 4.48% projection.
| Year | Annual Salary | Status |
|---|---|---|
| 2021 | $47,799 | Actual |
| 2022 | $49,026 | Actual |
| 2023 | $51,167 | Actual |
| 2024 | $99,910 | Actual |
| 2025 | $56,951 | Actual |
| 2026(current) | $59,502 | Estimated |
| 2027 | $62,168 | Projected |
Based on 5 years of BLS OEWS data for the Sterling Heights metropolitan area, the median data analyst salary grew 19.1% from $47,799 (2021) to $56,951 (2025). At a 4.48% compound annual growth rate, salaries are projected to reach $62,168 by 2027 — a total increase of $14,369 (30.06%) from 2021.
Note: Historical values (2021–2025) are actual BLS OEWS figures for the Sterling Heights metropolitan area, sourced from annual Occupational Employment and Wage Statistics surveys. 2026–2026 figures are current estimates, and 2027 values are projections, calculated using a 4.48% CAGR derived from 5-year BLS historical data. Actual salaries may vary based on employer, experience, certifications, and local market conditions.
Salary by Experience Level
| Experience | Estimated Salary Range |
|---|---|
| 0-2 years (New Graduate) | $34,512 – $42,842 |
| 3-5 years (Mid Career) | $42,842 – $59,502 |
| 5+ years (Experienced) | $59,502 – $76,163 |
| 10+ years (Top Earner) | $76,163 – $92,229 |
DA salary ranges estimated from BLS percentile data. Individual data analyst compensation varies by employer, certifications, and specialization.
Data Analyst Job Market in Sterling Heights
With only 29 data analysts currently employed in Sterling Heights, the local job market can be competitive. The cost of living index stands at 93.2, suggesting that while salaries may appear lower than the national average, the relative affordability could enhance purchasing power for residents. Leading employers such as large tech firms or consulting groups often provide the highest compensation packages in the area. The variance in salaries is often tied to company reputation, job level, and the complexity of the role. For instance, those pursuing positions in machine learning or quantitative finance typically command higher pay than those in traditional data analyst roles. Candidates aiming to maximize their earnings should focus on building skills aligned with high-demand specialties and consider negotiating equity components in their offers, especially with technology firms that offer significant stock options as part of their compensation structure.
More salary data for Sterling Heights, MI:
Frequently Asked Questions
How much do data analysts make in Sterling Heights, MI in 2026?
Is Sterling Heights, MI a good place to work as a data analyst?
Can data analysts make $100K in Sterling Heights?
What is the cost-of-living adjusted data analyst salary in Sterling Heights?
How much does a data analyst make per hour in Sterling Heights?
Related Pages
Compare Salaries
Career Resources
Nearby Cities in Michigan
Written by Aisha Patel, MA, Certified Data Analyst
Career Analyst
Aisha has 10 years of experience in data analysis. She specializes in business intelligence and works at a tech consulting firm.
Methodology & Data Source
Salary figures on this page are 2026 projections based on the Bureau of Labor Statistics Occupational Employment and Wage Statistics (OEWS) survey, May 2026 release. The BLS reported a median annual salary of $56,951 for data analystsin the Sterling Heights metropolitan area. A 4.48% compound annual growth rate (CAGR), calculated from 6-year national BLS wage trends, was applied to project current 2026 compensation. Percentile ranges (P10–P90) represent the full salary distribution across experience levels and practice settings in this market.
Data Sources & Methodology
Salary data for Sterling Heights is estimated from official BLS state-level occupational wage data (2025), adjusted for regional cost-of-living differences using BEA RPP (Regional Price Parities).
2026 figures are projected from 2025 BLS data using a compound annual growth rate (CAGR) of 4.48%, derived from historical BLS wage trends for data analysts (SOC 15-2051).
Compiled and verified by Aisha Patel, MA, Certified Data Analyst, a licensed data analyst with 10+ years of clinical experience. · View source data at BLS.gov